Becton Dickinson


Challenge
To shape a new brand story for medical technology company Becton Dickinson, our team asked key stakeholders a series of questions about how they saw the brand.
The resulting data was dense and unnavigable, so I needed a way to present the findings back to the client in an engaging and digestible format.
Senior Designer · The interactive presentation and its visualizations
Solution
The solution was an interactive presentation organized into sections by question theme. It could be presented live with our team’s analysis or browsed independently by client team members for deeper review.
Visitors could choose their own path: explore a single section, view the full report in sequence, jump to key takeaways or see all diagrams without analysis. Because the content was data heavy, high-contrast rollovers brought the visualizations to life and encouraged engagement.
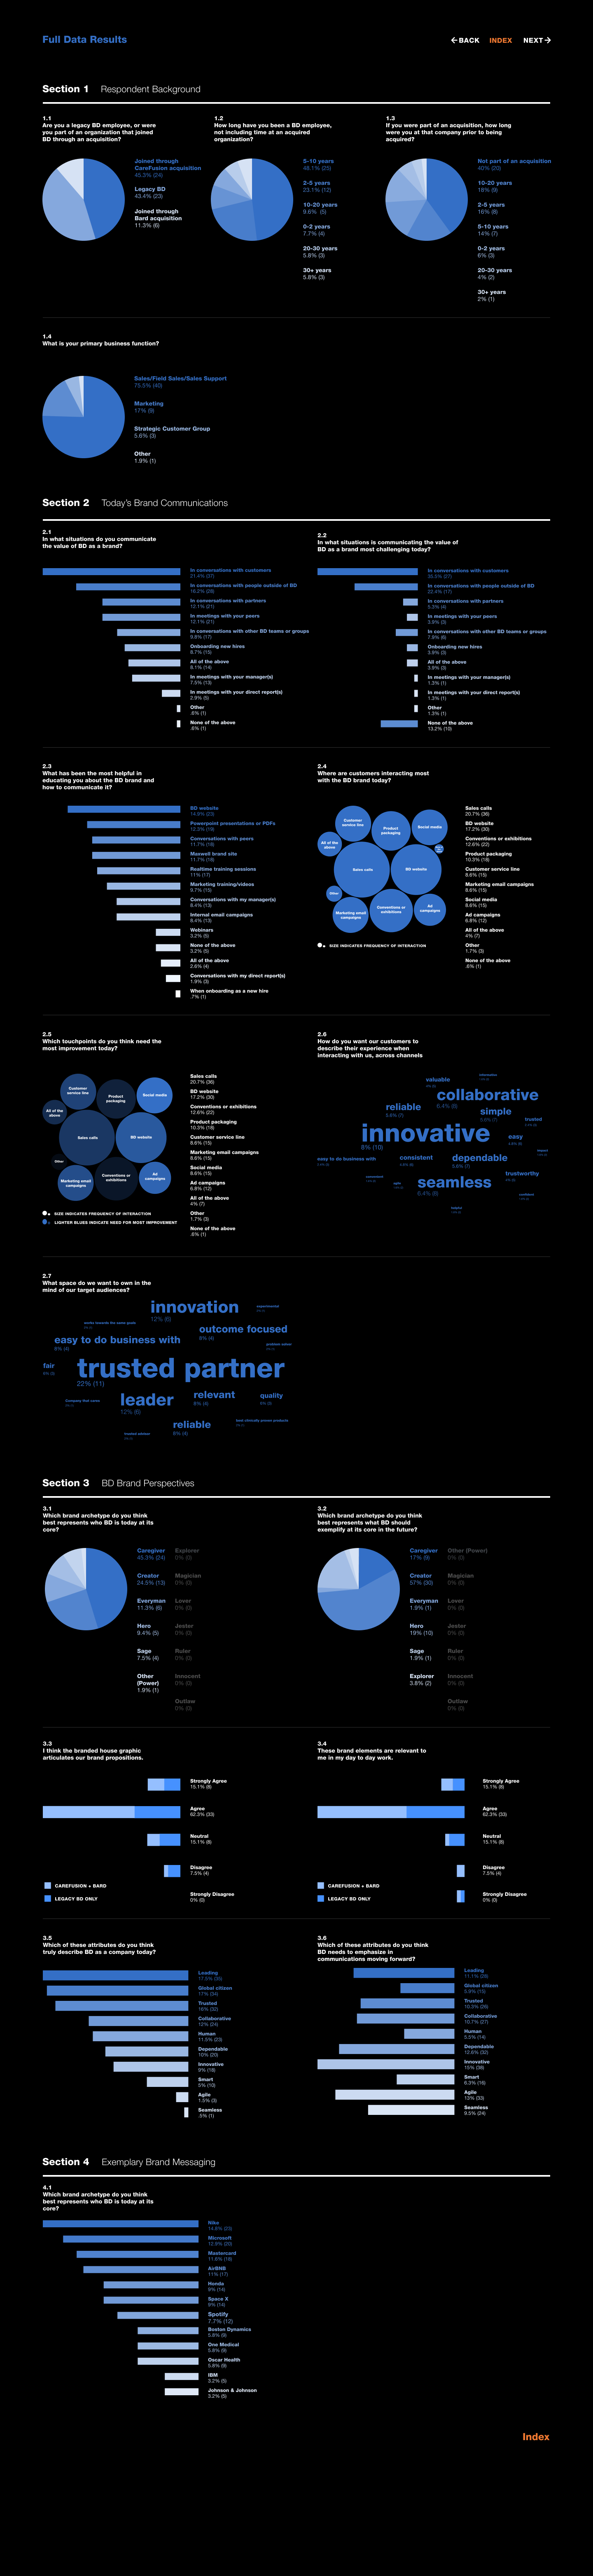
Visitors with a specific question could skip the interactivity entirely and view every visualization on one consolidated page.
Outcome
The findings shaped the new brand story the team went on to write for BD.